2D color options
Posted: 08 Jan 2011 19:39
Hello, i´ve been working with this wonderful software since one year ago. I think your are doing a huge work. Congratulations.
I suggest a few things:
The color contrast in the background isn´t enough. For instance, i´d like to see RH variable with 2 (maybe 3 ) color. One might be red for RH higher than 85% and the other color might be completly different (green) ( to get big contrast)(lower than 85%).
It would be great to set the range of each color, and the colors it self. Inside each color, this might be shown in a scaled way. This option might be available for most variable (RH, T,..)
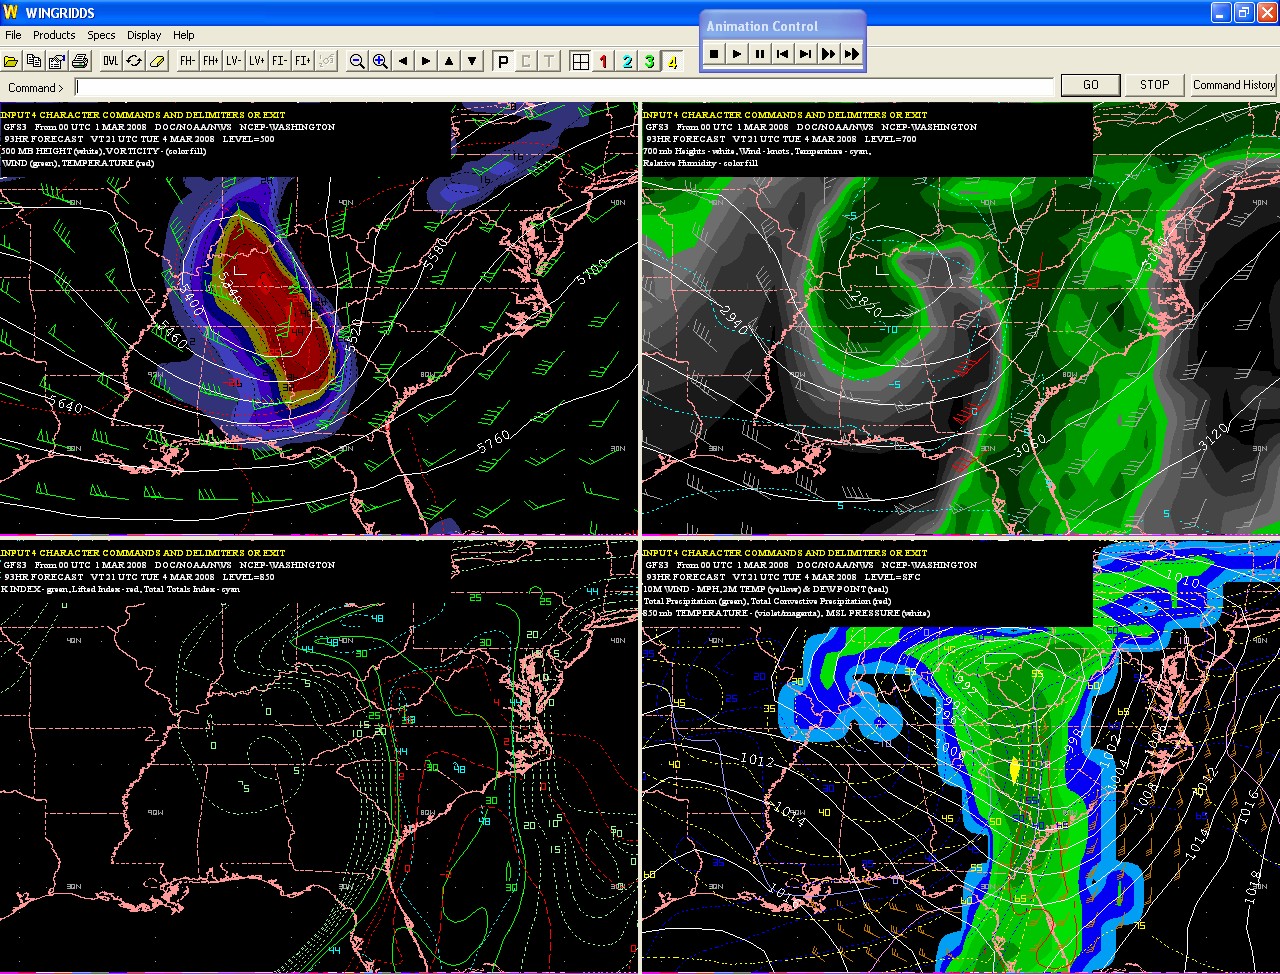
i saw something like that in this web site. http://winweather.org/4panel1.jpg
sincerely
Olivier
I suggest a few things:
The color contrast in the background isn´t enough. For instance, i´d like to see RH variable with 2 (maybe 3 ) color. One might be red for RH higher than 85% and the other color might be completly different (green) ( to get big contrast)(lower than 85%).
It would be great to set the range of each color, and the colors it self. Inside each color, this might be shown in a scaled way. This option might be available for most variable (RH, T,..)
i saw something like that in this web site. http://winweather.org/4panel1.jpg
sincerely
Olivier